Ireland's sectoral emissions mitigation achievement for 2021–2025 is much worse than the EPA report has stated
Paul Price 21 August 2026
In the previous post, I set out some necessary caveats to the EPA's summary statement on national mitigation achievement over the first carbon budget period (CB1 2021–2025) that were not made sufficiently clear in its recent report, Ireland’s Provisional Greenhouse Gas Emissions 1990-2025, published in July.
In this commentary, I critique the summary statement assessing sectoral mitigation achievement in the same EPA report. The report states that of the seven climate action plan (CAP) sectors: four had stayed within their sectoral emission ceiling (SEC), and three had not. To date, Governments have failed to define an SEC for the LULUCF (land use, land use change and forestry) sector.
But, as detailed below, using the EPA's reported 2026 provisional emissions values, even a simple inspection of the sectoral indicative target percentage reductions by 2025, relative to 2018, finds that only one of the seven CAP sectors (Buildings-Residential) met its target, and the other six did not.
Further, a more involved and more meaningful Revised analysis, based on indicative sectoral target budgets for 2021–2025—assuming linear mitigation from 2018 as per EPA reporting—similarly finds that Buildings-Residential was the only CAP sector that achieved its 2025 target mitigation.
This detailed Revised assessment finds that Agriculture, Transport, Electricity, and Industry, contributed the bulk of a substantial 16 MtCO2e total emissions tonnage exceedance relative to a corrected revised CB1 budget of 278 Mt relevant for appropriate mitigation progress assessment. This compared to the EPA assessment, which found emissions for 2021–2025 to be -1.1 MtCO2e less than the originally agreed CB1 of 295 MtCO2e (not allowing for emissions of perhaps 6 MtCO2e due to storm windthrow forest losses).
Specifically, the key issue requiring correction to enable appropriate mitigation assessment is that, due to scientific updates, the 2018 total emissions value for Ireland in EPA GHG inventory reports has been revised downward from 2021's 68.3 MtCO2e to 2026's 64.5 MtCO2e.
The 2018 total GHG value was the basis for the Oireachtas-accepted five-year carbon budgets (CBs) and the constituent sectoral emission ceilings (SECs) defined by Government in 2022. Therefore, the substantive downward revision to the accounted 2018 total value invalidates the EPA 2026 Provisional report's sectoral mitigation assessment because it depends on the 2022 SEC values that are now outdated due to the inventory revisions since 2021.
In their 2024 Cross-sectoral Review, the Climate Change Advisory Council (CCAC) recognised this as a serious issue requiring ongoing methodology adjustments to "proactively" ensure the relevance of any mitigation assessment.
The EPA do excellent work in maintaining and updating Ireland's GHG emissions time-series, but, given the CCAC's clear warning, it is concerning that the 2026 EPA report provides a misleading summary of sectoral mitigation achievement, based on outdated SEC values, even while acknowledging the need for SEC value revision to ensure relevant assessment. No proactive assessment method revision has occurred.
By issuing insufficiently caveated national and sectoral summary statements that do not quantify outcomes (including LULUCF) relative to sectoral indicative reductions, the EPA 2026 Provisional report's summary statement asserts greater mitigation achievement than has actually occurred.
Thus, the EPA's mitigation assessment for 2021–2025 risks misinforming government, sectoral actors, the media and the public, potentially resulting in insufficient policy corrections that will contribute to even greater future mitigation failure.
As the CCAC warned in 2024, if inventory adjustments are not reflected in revised CB and SEC adjustments then mitigation assessments based on outdated values will "not reflect actual progress towards decarbonisation of Ireland’s economy" and the resultant policies in response "may well lead to perverse socio-economic outcomes".
This commentary presents and quantifies an appropriate methodology, based on the 2022 SEC table's indicative 2025 percentage reductions. It is now important that the EPA, CCAC and government revise their mitigation assessment methodology, accordingly or otherwise explicitly, as a matter of urgency to ensure their relevance and avoid presenting misleading national and sectoral mitigation assessments.
Comparing CCAC 2024 assessment concerns and the EPA 2026 sectoral summary statement
In its 2021 Carbon Budget Technical Report, based on the 2018 base-year inventory value for total emissions including LULUCF, the CCAC recommended the first two CBs: CB1, 295 MtCO2e for 2021–2025, with a stated -4.8% annual average percentage change in emissions; and, CB2, 200 MtCO2e for 2026–2030, with a much more rapid -8.3% stated annual change.
In turn, as the 2021 climate Act required, these CBs, dependent on the 2018 total emissions value used by the CCAC, became the basis of the constituent sectoral emission ceilings (SECs) set out by Government in the September 2022 SEC document's key table, as replicated in the partial screenshot in Figure 1 below.
Note that, contrary to the Act's requirement to state an SEC for every sector, Government failed to set out (and has continued to fail to set out) an SEC for LULUCF. However, the CB1 period value for LULUCF is directly implied as being 20 MtCO2e because this is the residual amount once the sum of all other sectors' SECs are subtracted from CB1.
The ongoing problem for national or sectoral mitigation assessment is that the substantial scientific updates to LULUCF and Agriculture inventory values since 2021 mean that the 2018 base year total and all related SEC values have reduced sufficiently to invalidate the 2018 emissions basis of the defined SECs. Thus, even though the CB1 and CB2 tonnage values agreed in 2022 are legally binding and SECs were thence derived, the accounting updates require that adjusted CBs and SECs aligned with the SEC table's stated sectoral indicative reduction percentages be revised for meaningful assessment of mitigation progress.
The CCAC recognised this as a crucial issue for mitigation assessment in their 2024 Cross-sectoral Review by stating:
In the context of the Climate Action and Low Carbon (Amendment) Act 2021 and the existence of fixed carbon budgets, such emissions inventory updates represent a significant challenge. Such significant revisions to the inventory need to be addressed proactively to ensure that carbon budgets, and associated sectoral emissions ceilings, remain relevant and aligned with the National Climate Objective. Reductions in estimates of emissions will make both the national carbon budgets and impacted sectoral ceilings easier to comply with and vice versa but do not reflect actual progress towards decarbonisation of Ireland’s economy, which is what matters from a climate system perspective. Not updating carbon budgets and sectoral ceilings may well lead to perverse socio-economic outcomes. – CCAC 2024 Cross-sectoral Review
Concerningly, the CCAC's warning has not been heeded in the EPA 2026 Provisional report summary statement on sectoral mitigation achievement, which reads:
Provisionally, 4 sectors have stayed within their SEC; Buildings (Residential), Buildings (Commercial and Public), Agriculture and Other. The other 3 sectors have exceeded their SEC; Electricity, Transport and Industry.
For Agriculture this was largely driven by refinements to the agricultural inventory. The National Climate objective of a 51% reduction by 2030 will be unattainable unless every sector meets its indicative percentage reduction target. Consequently, sectoral ceilings must be revised to account for updated science in emissions inventory data. – EPA 2026 Provisional Report
Thus, this summary statement proceeds to compare its provisional 2021–2025 emissions directly, but misleadingly, with the outdated 2022 SECs. Despite noting the need for sectoral ceilings revision, the statement and the report fail to show or in any way quantify the difference in sectoral outcomes that using the more relevant indicative percentage reduction targets instead would make in a more meaningful revised assessment.
In its reporting since 2021, the EPA has repeatedly stated that both the agreed carbon budgets and indicative percent reductions relative to 2018 via straight-line annual emission reduction are valid gauges of climate mitigation achievement.
Thus, given the inventory changes affecting the carbon budgets and sectoral ceilings, a more meaningful measure of sectoral mitigation achievement over the CB1 period is to compare the Provisional report's sectoral emissions over 2021–2025 with revised sectoral budgets, based on the 2026 Provisional values for 2018 and linear mitigation from 2018 to the 2025 percentage indicative reductions for each sector. For each sector, these percentages are stated in the 2022 SEC table, as shown in Figure 1, and the LULUCF percentage can be obtained by calculation.
The remainder of this post quantifies revised method assessments based on the indicative percentage reduction targets. The results strongly confirm the importance of the CCAC warning by showing a very different outcome from the EPA report by using the more relevant revised assessment.
Therefore, the EPA statement should be withdrawn and sectoral mitigation should be re-stated with due quantification based on each sector's indicative target percentage reduction.
A simple 2025-only target percentage sectoral mitigation assessment
Since the key table in the 2022 SEC document presents approximate indicative reduction emission targets as percentages relative to 2018, a straightforward but simplistic sectoral assessment is to compare the target 2025 percentage values with the actual achieved percentage reduction by 2025, based on the EPA 2026 provisional data, as shown in Table 1 below.
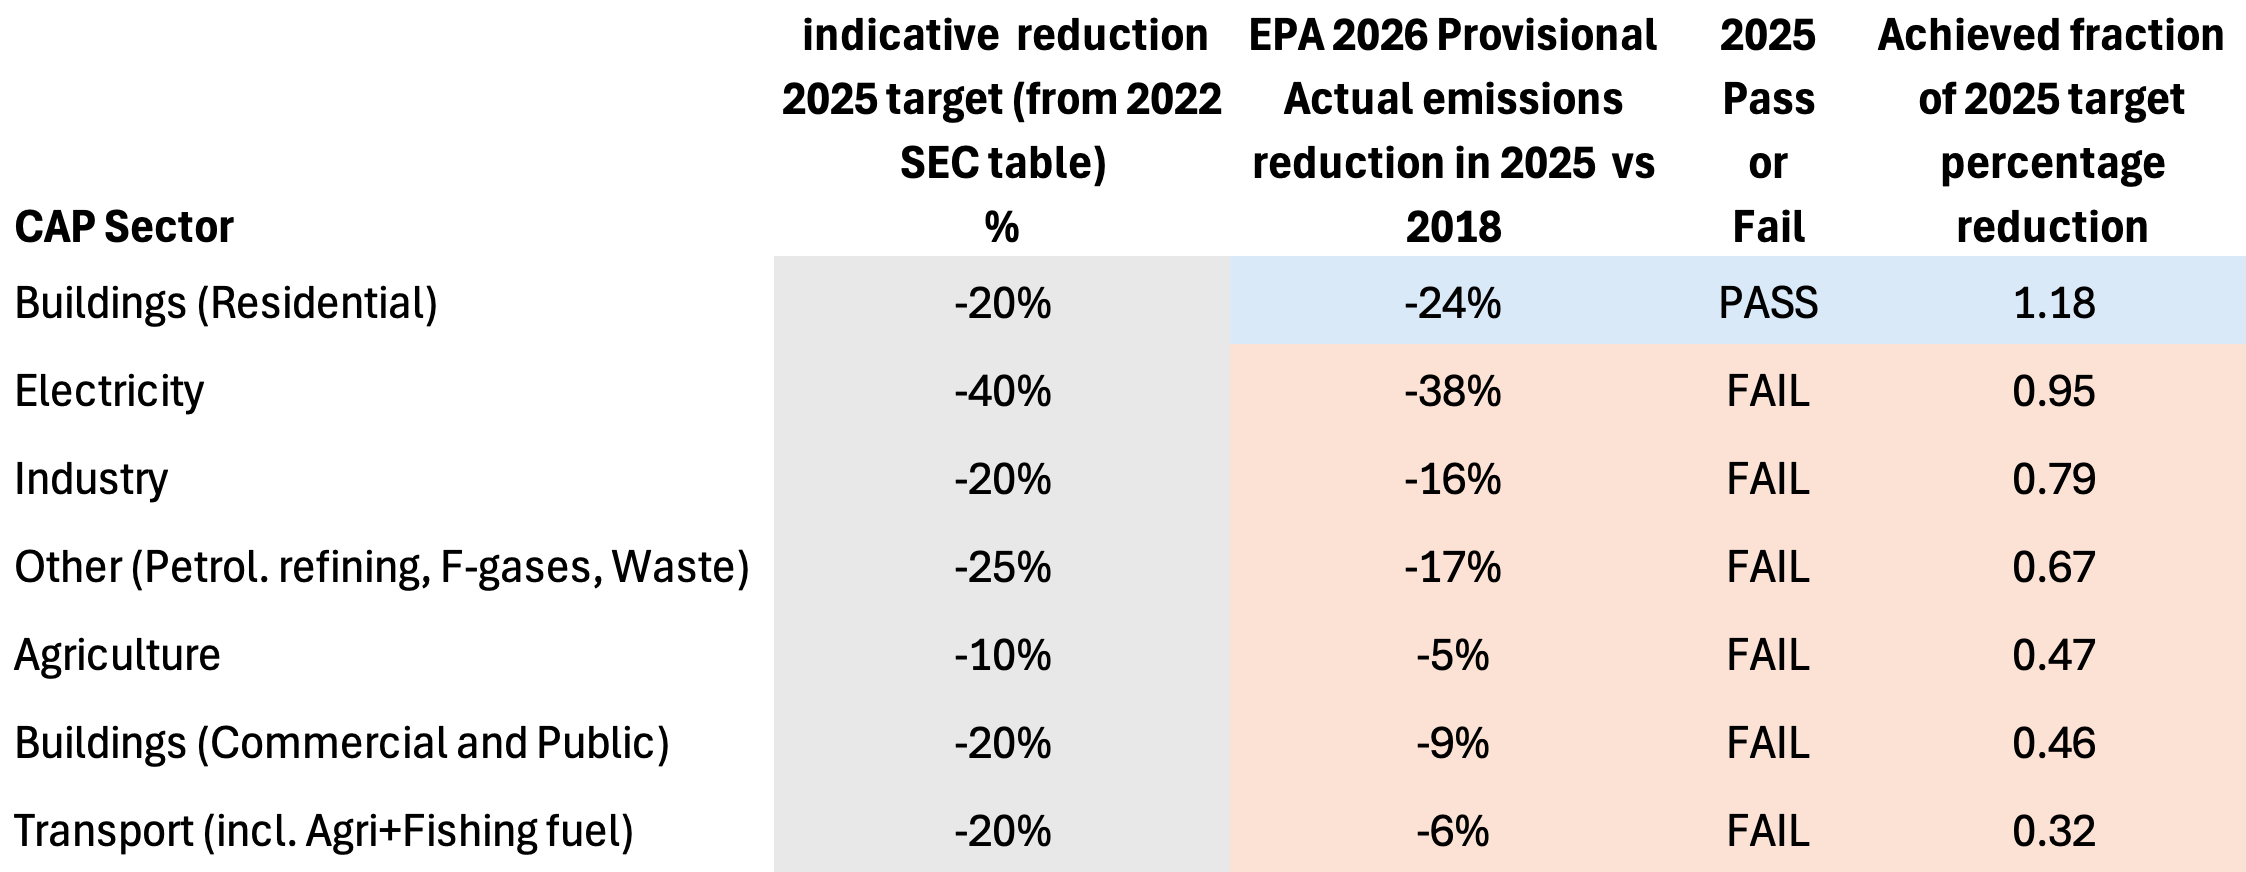
Based on the single year 2025 alone, Table 1, ordered by fraction of target percentage achieved clearly shows that the EPA summary statement is highly questionable.
- Only Buildings-Residential met its SEC goal, by achieving a greater reduction (-24%) its indicative reduction target percentage (-20%).
- Electricity only fell slightly short of its target reduction – although, as per the previous post, a substantial fraction of electricity is now being imported and is accounted as zero emissions.
- Industry and Other also failed to achieve their target 2025 percentage reductions.
- The sectors with the worst mitigation achievement on this single year basis were Agriculture, Buildings-Commercial|Public, and Transport which all achieved less than half of their 2025 target mitigation.
- For the two largest emitting sectors: Agriculture had a target of cutting emissions by -10% by 2025, yet it only achieved a -5% reduction; and, Transport was worst of all, with a target of -20%, yet it only achieved a -6% reduction.
A more detailed, Revised method for sectoral mitigation assessment, using indicative 2021–2025 budgets
Crucially, the EPA's 2026 sectoral achievement statement fails to point out that the inventory updates do not only affect the LULUCF and Agriculture sectors, they also substantively change the 2018 emissions total that was the base year value that the CCAC used in recommending the five-year carbon budgets (CBs).
Therefore, a more detailed revised method sectoral mitigation assessment can use the most recent emissions values for 2018–2025 (as stated in the EPA 2026 Provisional report) combined with the SEC 2022 table's stated 2025 approximate indicative percentage reductions for each sector, assuming linear annual mitigation from 2018.
This method more appropriate now due to the inventory updates, but it is also more relevant because these percentage reductions by 2025 and 2030 were the primary subject of political debate toward setting the SECs in 2022, notably that was a particularly strong debate in relation to Agriculture.
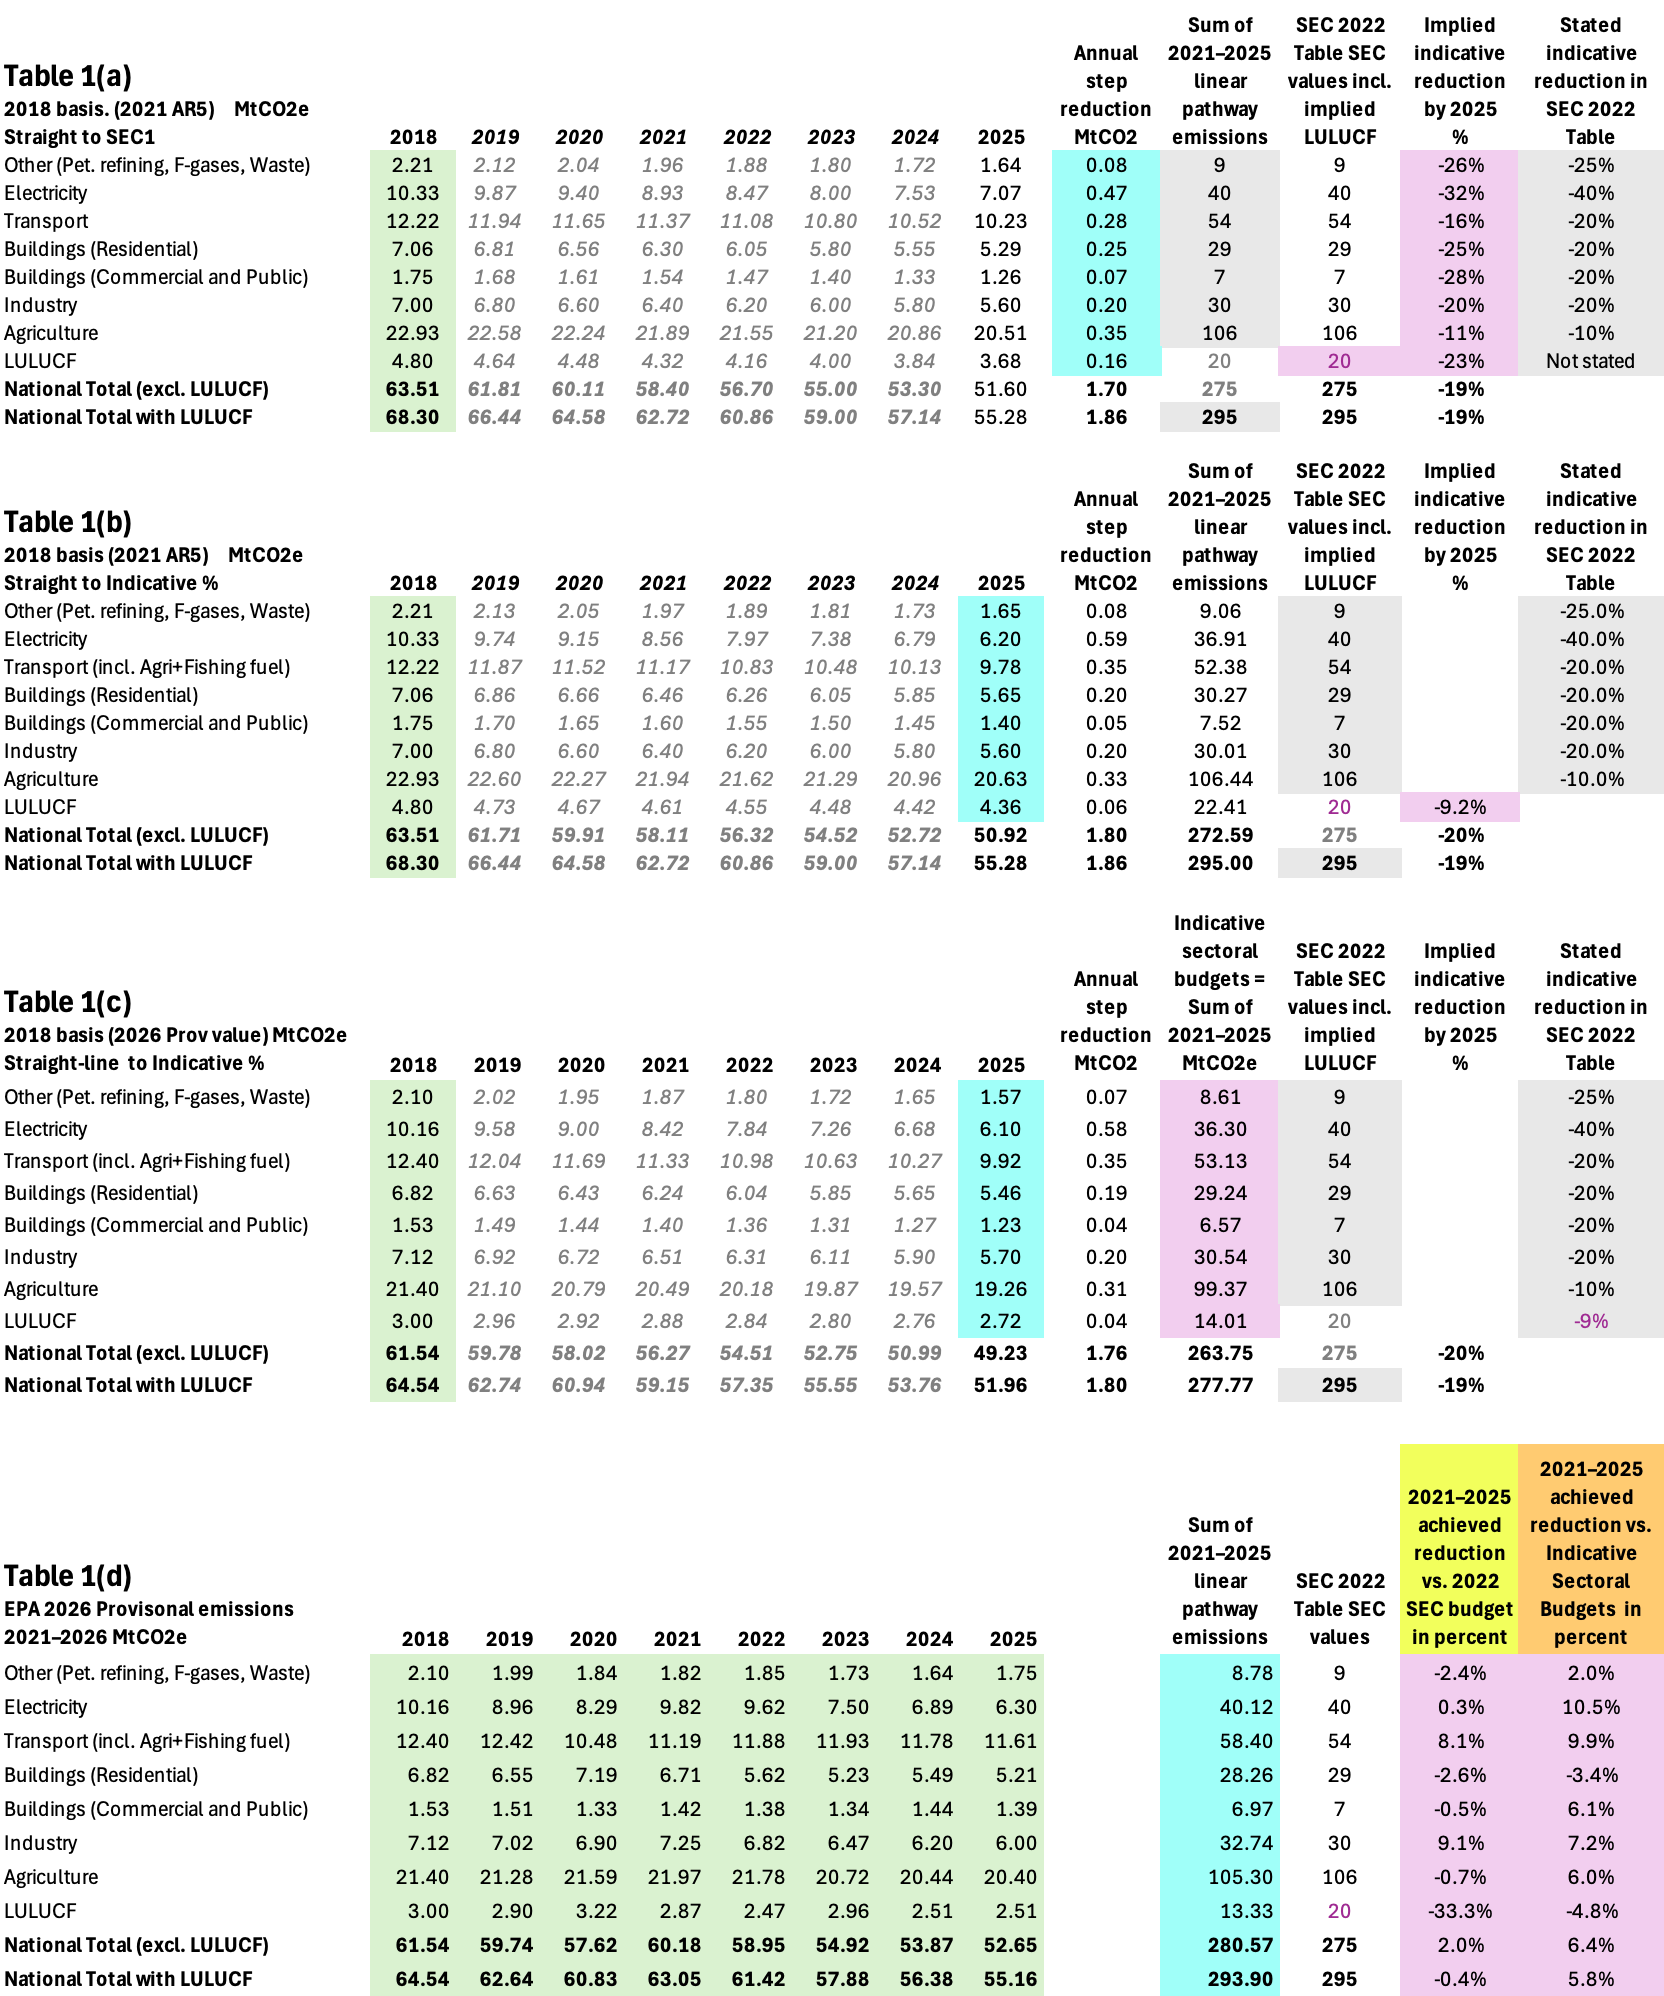
For brevity, the detail of the calculations for this revised method is omitted here but the calculation tables used are shown in Note 1, the footnote at the end of this commentary.
First, the 2025 percentage reduction for LULUCF can be calculated for the named CAP sectors using linear pathways from the original 2018 values (as used by the CCAC in 2021) to the indicative reduction percentages stated in the SEC 2022 Table, and requiring the CB1 of 295 MtCO2 to be met, the implied indicative 2025 percentage reduction for LULUCF is calculated as 9.2%.
Using the updated sectoral 2018 values stated in the EPA 2026 Provisional emissions report combined with the indicative reduction percentages by 2025 relative to 2018 (as stated in the 2022 table and using the 9.2% calculated for LULUCF) and assuming linear mitigation pathways results in total 2021–2025 sectoral emissions.
From here-onward in this commentary, these totals are called 'indicative sectoral budgets'. In effect, these five-year budgets are the updated SECs that are implied by the stated percent indicative reductions when combined with the 2026 updated emissions values and linear mitigation from 2018 to 2025.
Table 2, below, sets out LULUCF and the CAP (Climate Action Plan) Sectors, as identified in the key table in the 2022 SEC document and as used by the EPA in its sectoral emission ceiling assessment in its 2026 Provisional emissions report. The columns are colour coded as follows:
- The yellow column, with values as used by the EPA assessment, presents the defined 2022 SECs for each named CAP Sector, as well as the undefined but implied LULUCF SEC of 20 MtCO2e.
- The orange columns, as used here in the Revised method, first present the 2022 table's stated approximate indicative percentage reductions for each sector and, second, the associated derived indicative sectoral budgets, based on linear annual tonnage reductions from the updated 2018 emissions values in the EPA 2026 Provisional report to the stated percentage reductions.
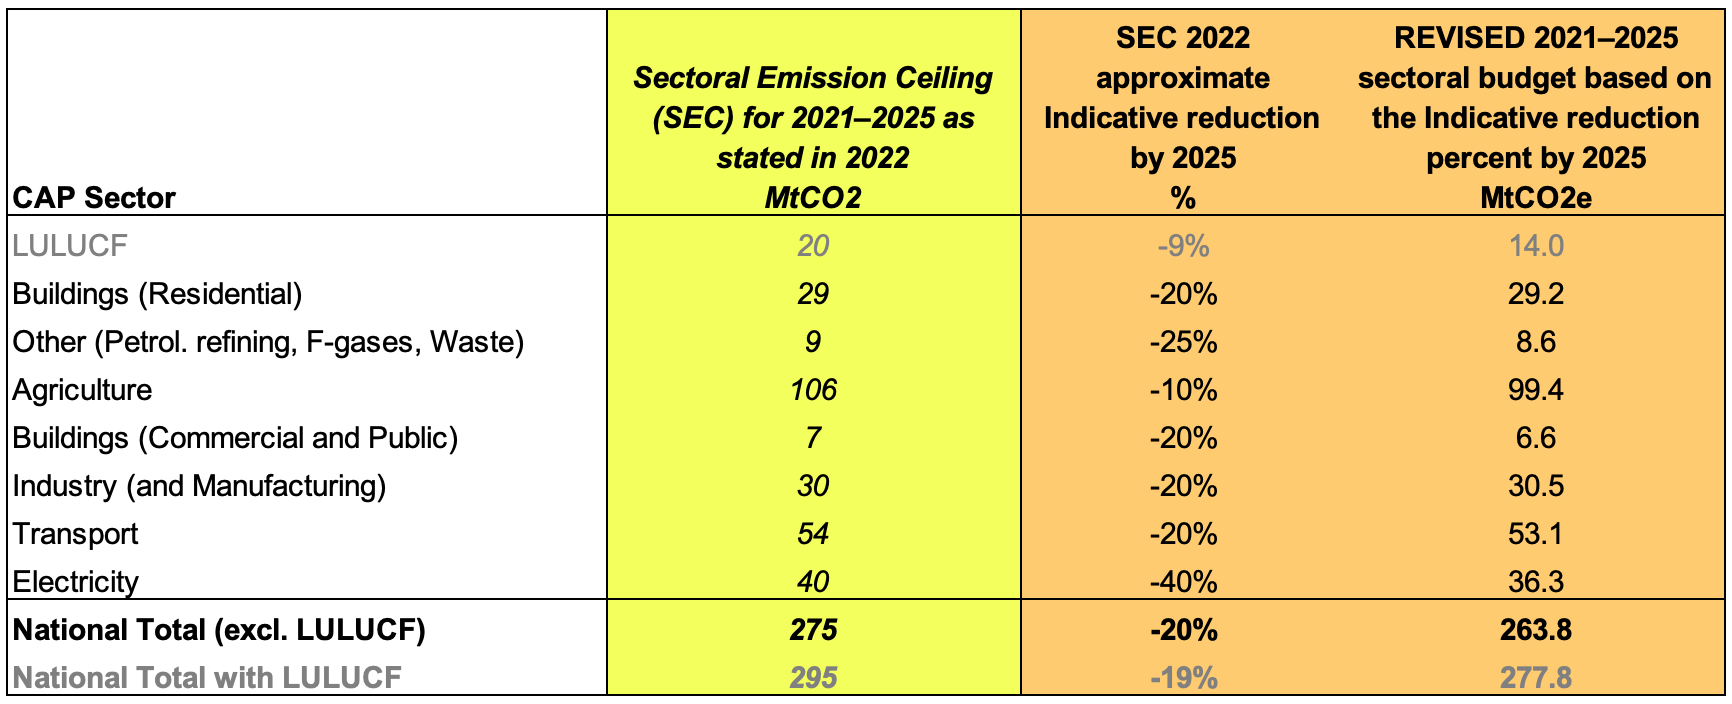
The defined SECs and the associated implied LULUCF SEC listed in the yellow column of Table 2 are the basis of the EPA 2026 Provisional method of sectoral mitigation assessment. The revised 2021–2025 indicative sectoral budgets in the rightmost orange column of Table 2 are the basis of this article's Revised method of sectoral mitigation assessment.
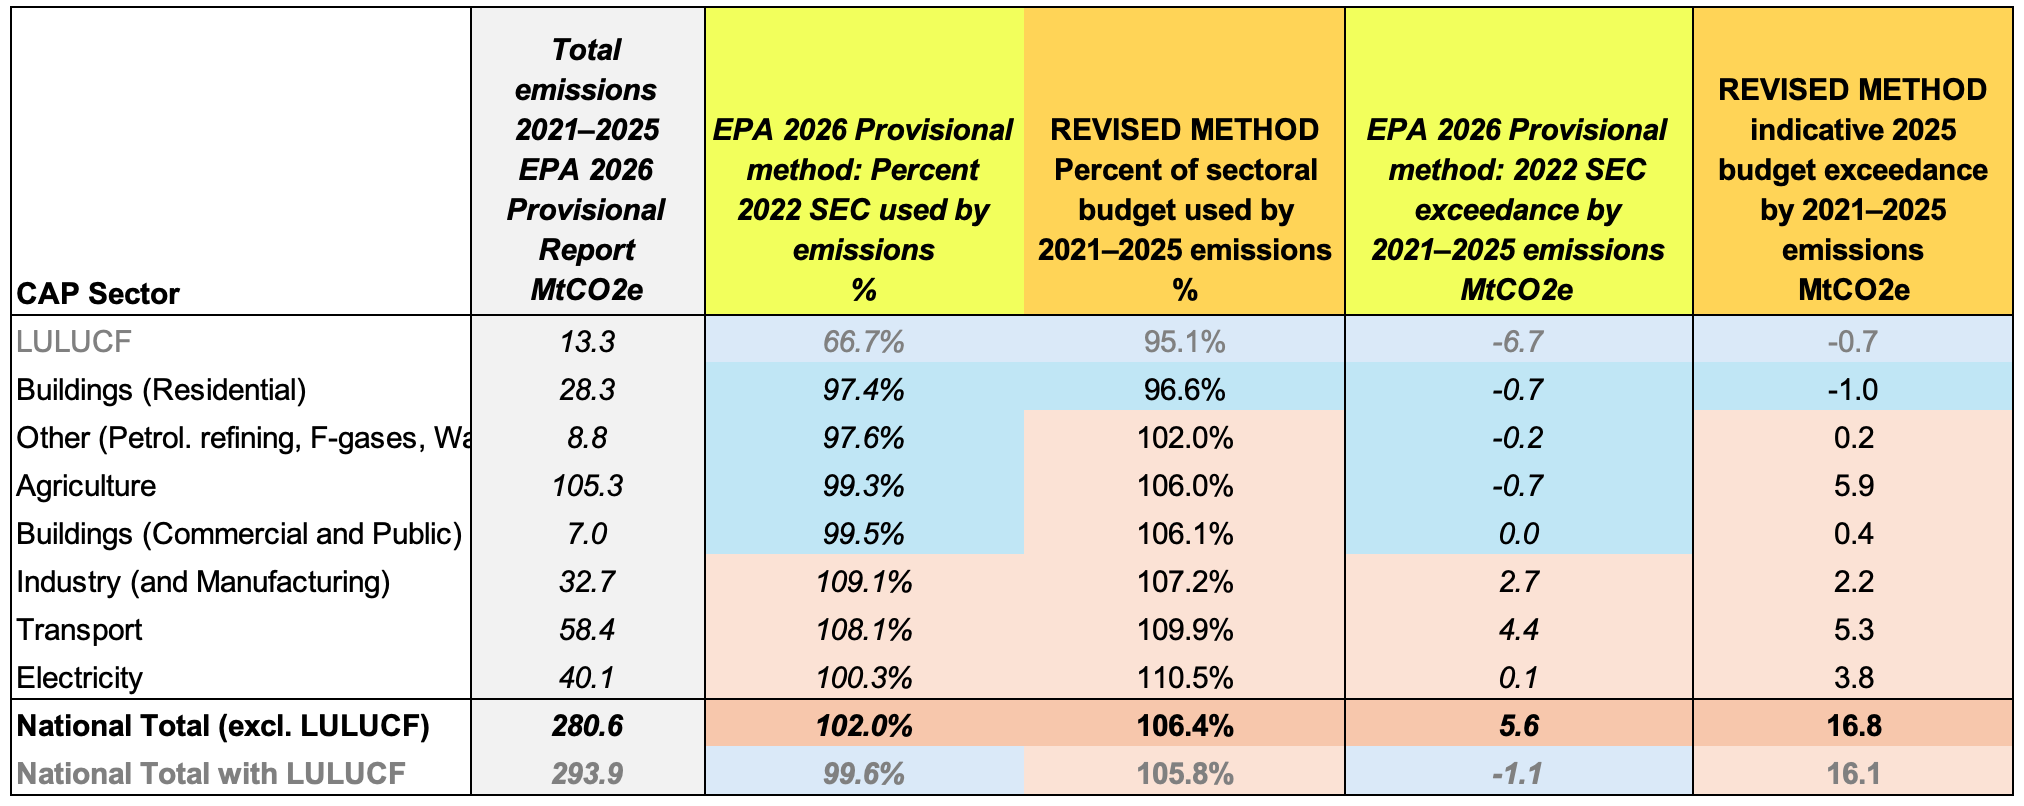
Table 3 shows the sectors and national total provisional emissions (grey shading). As with the simple method based on 2025 alone, the Revised method results (headed in orange) finds that mitigation failure in six out of the seven CAP sectors with only Buildings-Residential meeting its target.
- The indicative reduction percent by 2025 values are from the SEC document table, as well as a calculated, implied 9.1% LULUCF reduction, as required t0 sum LULUCF emissions with the other sectors to meet CB1.
- The next column shows the related 2021–2025 Sectoral budget for the indicative reduction percent by 2025, based on straight line reduction from the Provisional 2018 value to the given indicative reduction percentage by 2025.
- The third values column presents the CAP sector 2021–2025 emissions from the EPA 2026 Provisional report. Results of this revised method—the percentages of the calculated sectoral budgets used—are then presented for comparison with the rightmost column that shows the EPA method.
- As per the EPA report presentation, values are given as percent of budget used (2022 SEC or indicative). These are shaded: blue if equal or less than 100%, indicating sectoral mitigation 'success'; or, pink if more than 100% of the budget was used, indicating 'failure'.
Visual comparison of EPA versus revised method assessments
For clarity, a visual comparison of the Table 3 results is presented in bar charts form in Figures 1 and 2 below, for the EPA and Revised method, respectively. Note the different order of sector rankings between the figures. Also, note that the more detailed Revised method, which is a more meaningful five-year assessment produces a different ranking order and quantitative results to the simple 2025-0nly assessment shown in Table 1.
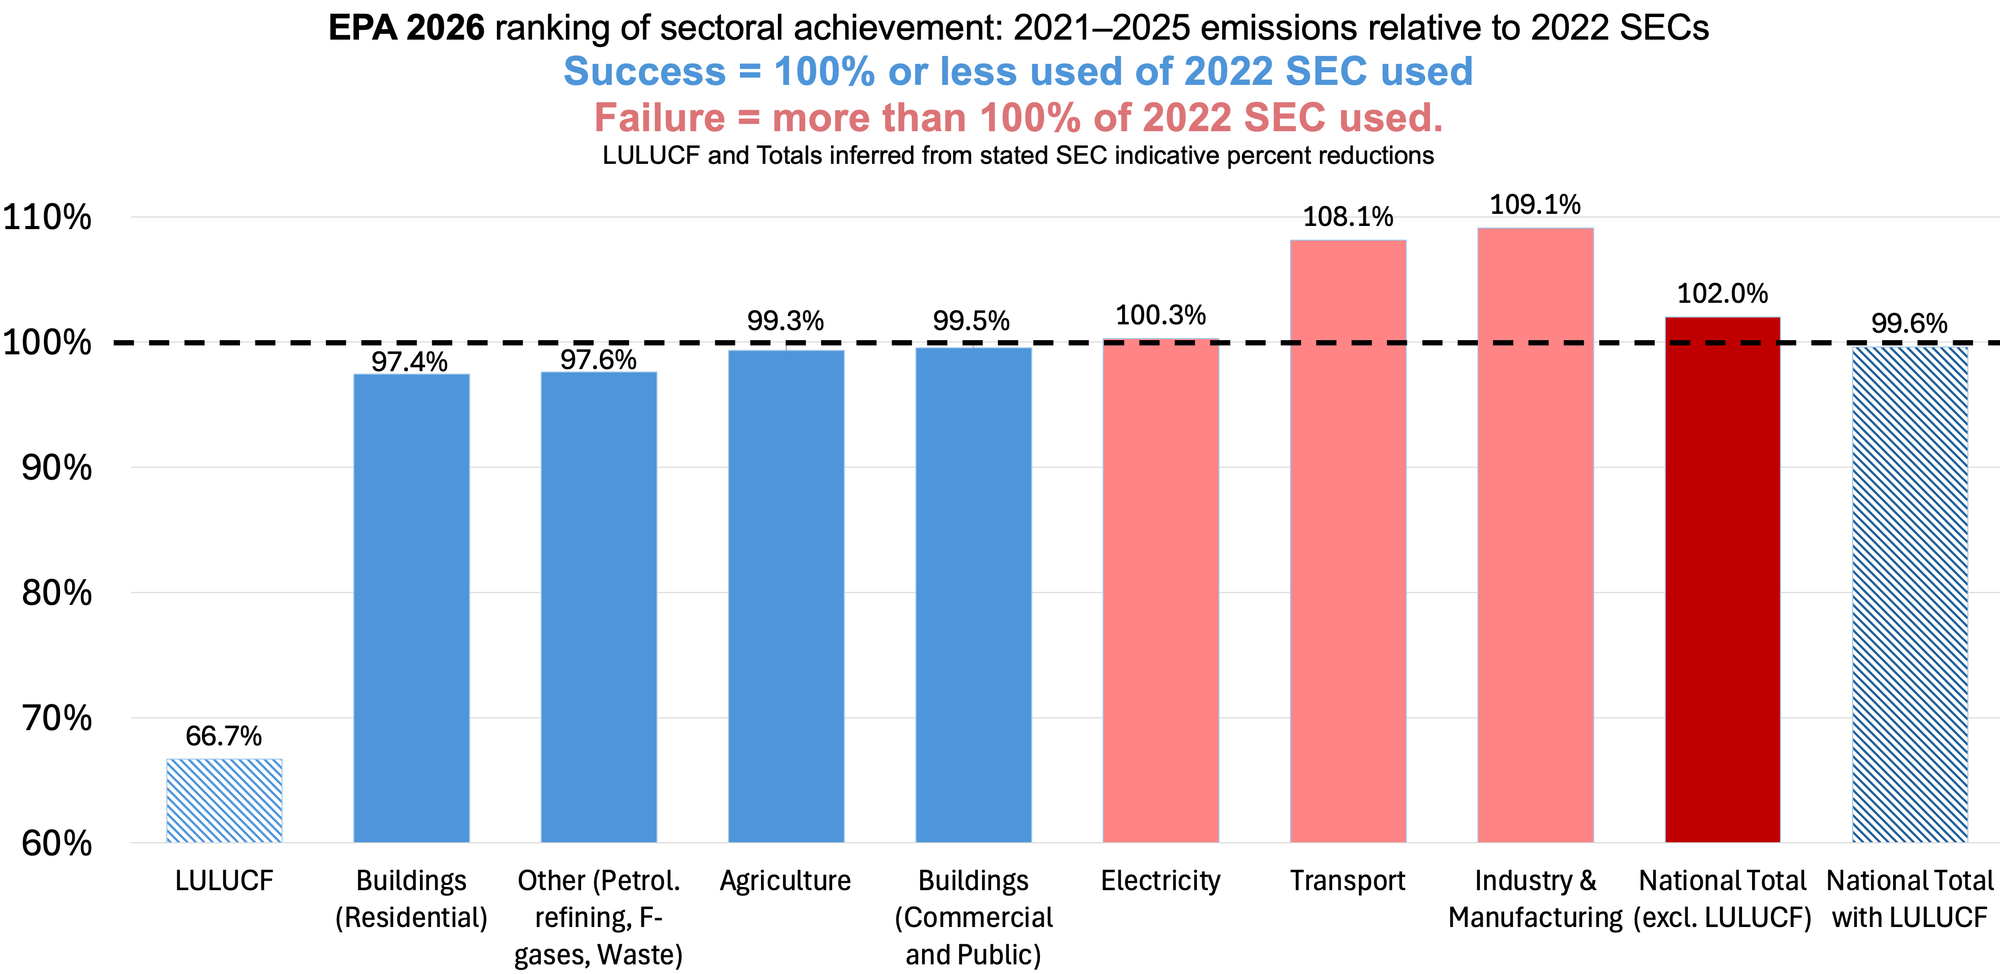
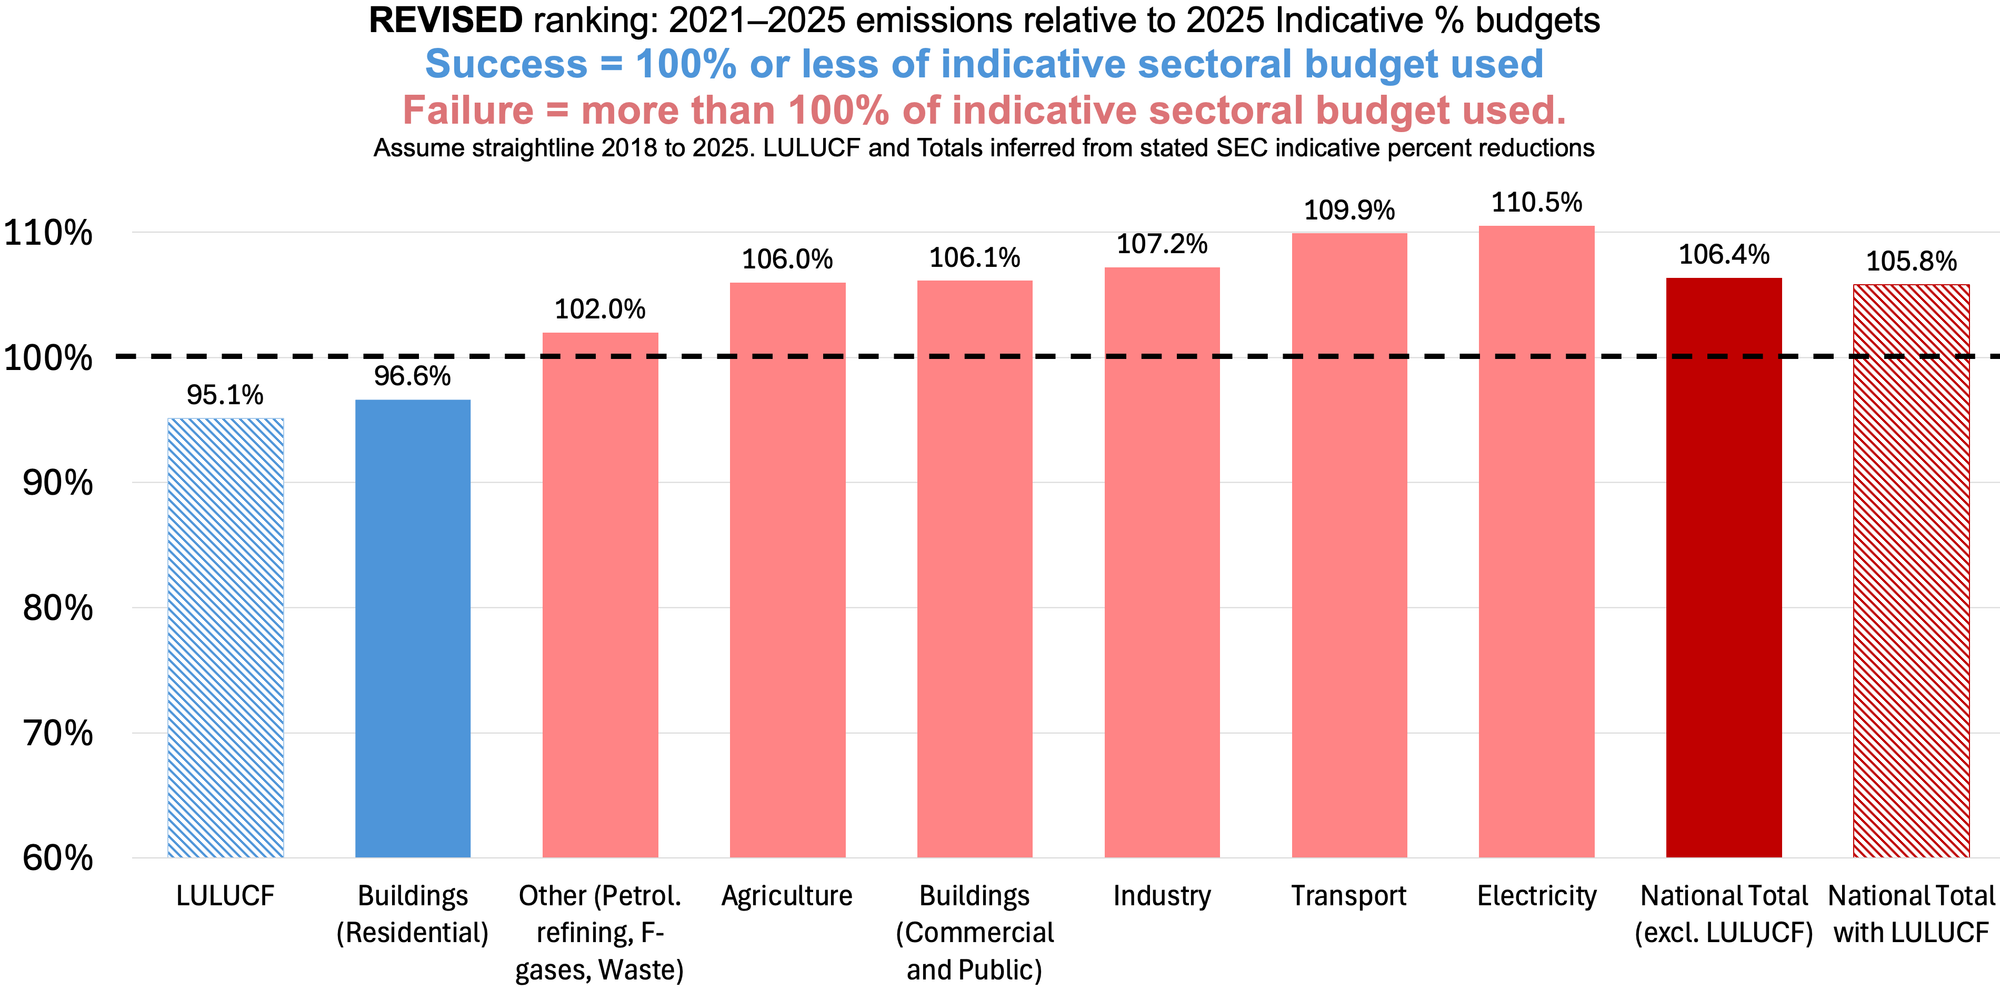
The 2021–2025 sectoral achievement assessment presented in Figure 2 based on the Revised method presents a far more concerning picture of mitigation progress than the Figure 1 presentation of the EPA 2026 Provisional CAP Sectors assessment.
In the EPA method, reliant on less meaningful SECs, four sectors stayed within their budgets (including Agriculture, the largest emitting sector), and Electricity only marginally exceeded its 2022 SEC. By comparison, using the revised method, only one sector, Buildings-Residential, stayed within its budget and all other sectors failed.
Results from the revised method showed increased values compared to the EPA method for all sectors except for slightly reduced outcomes in two sectors, Buildings-Residential and Industry (and Manufacturing). The revised method assessments are much worse than the EPA's for three sectors: Electricity (110.5% vs. 100.3%); Agriculture (105.3% vs. 99.3%); and, Buildings-Commercial and Public (106.1% vs. 99.5%).
The LULUCF values and assessments shown above for both methods are implied by the other 2022 SEC document table values. Due to the substantial revision of the LULUCF time-series due to scientific updates, the revised method LULUCF values are far more relevant than those derived from the 2022 implied LULUCF SEC.
It is evident from the Figures that the scientific updates to LULUCF have had a large effect in changing the overall mitigation assessment outcome in the Revised results.
Comparing exceedance tonnages using EPA 2026 and Revised methods
In Ireland's carbon budgeting, it is the tonnage exceedance of a five-year budget that is crucial because—as the 2021 climate Act, 6D.(5) states—any excess of total emissions relative to the total budget must be subtracted from the subsequent five-year national budget.
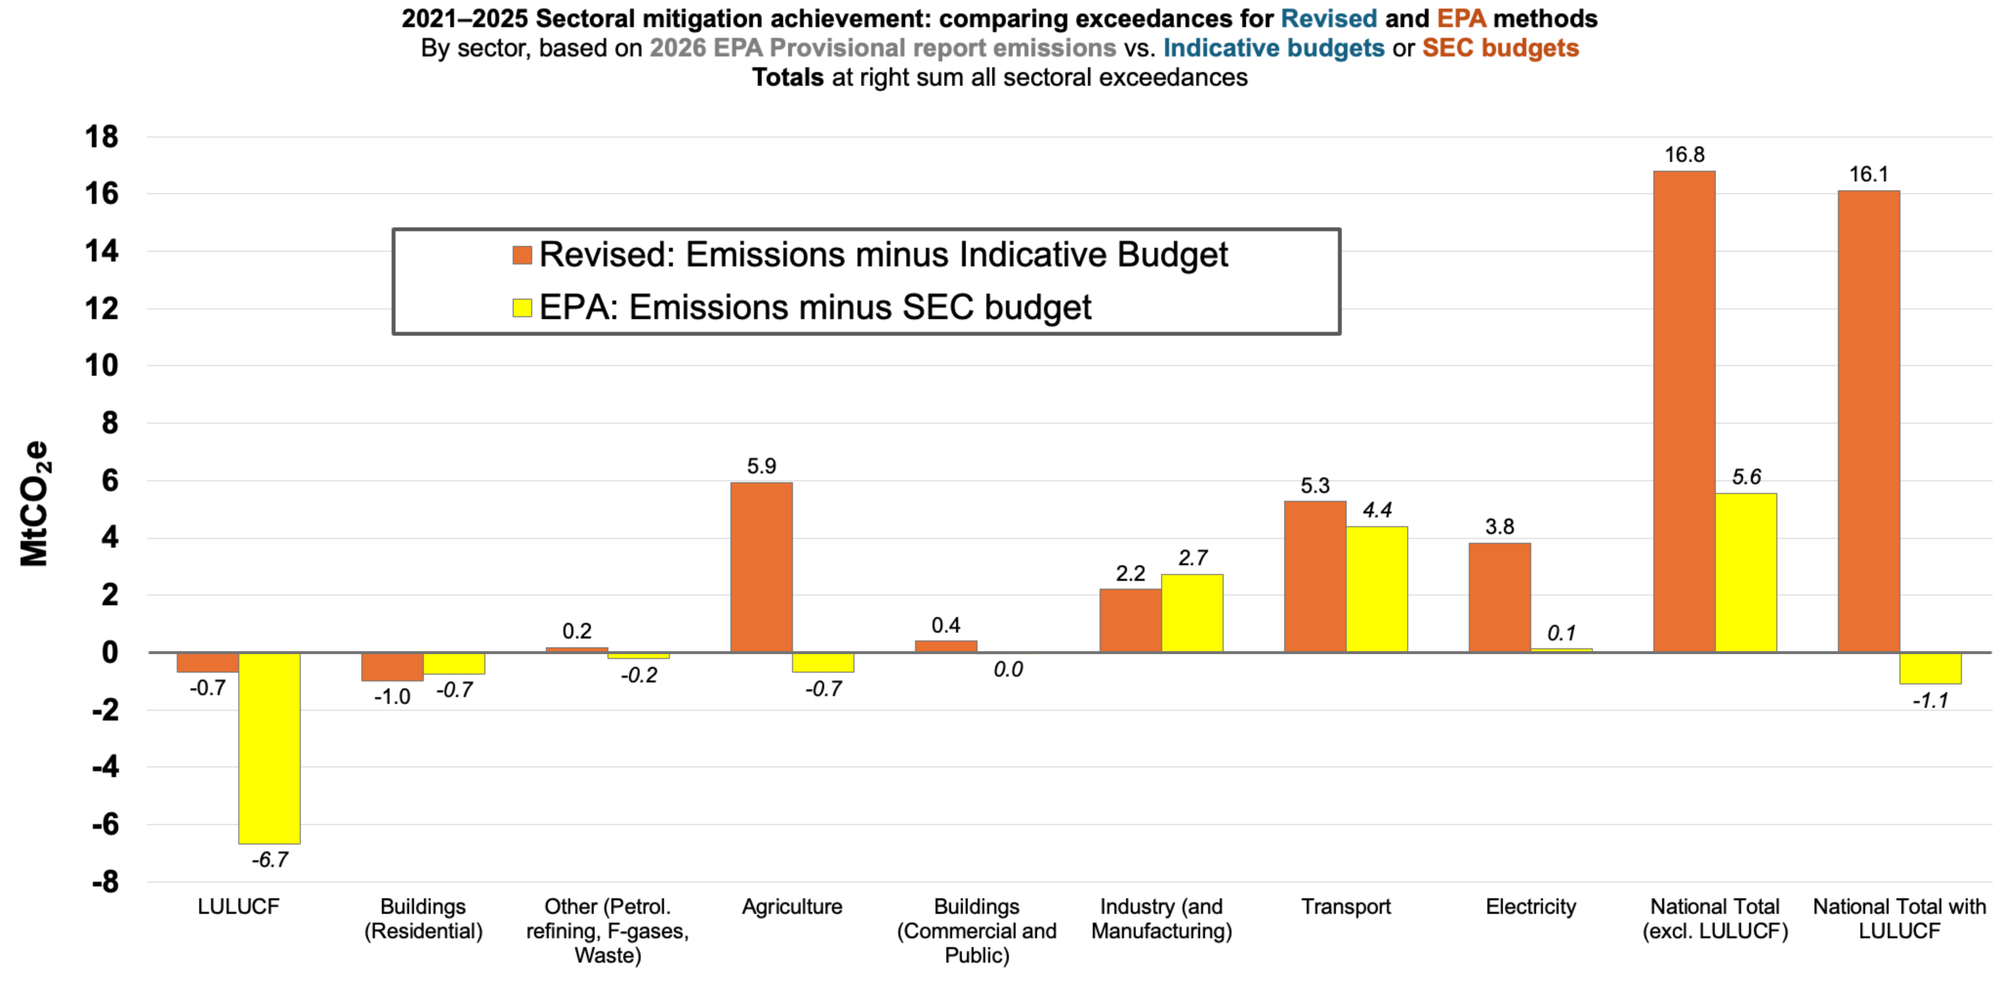
Table 4, below, presents the same data as in Table 3 except that the rightmost two columns compare the exceedance tonnage quantity results from the Revised method with the EPA method. The results are coloured as for the percentage results: blue for success if emissions for 2021–2025 are less than the indicative budget; red if the emissions exceeded the budget.
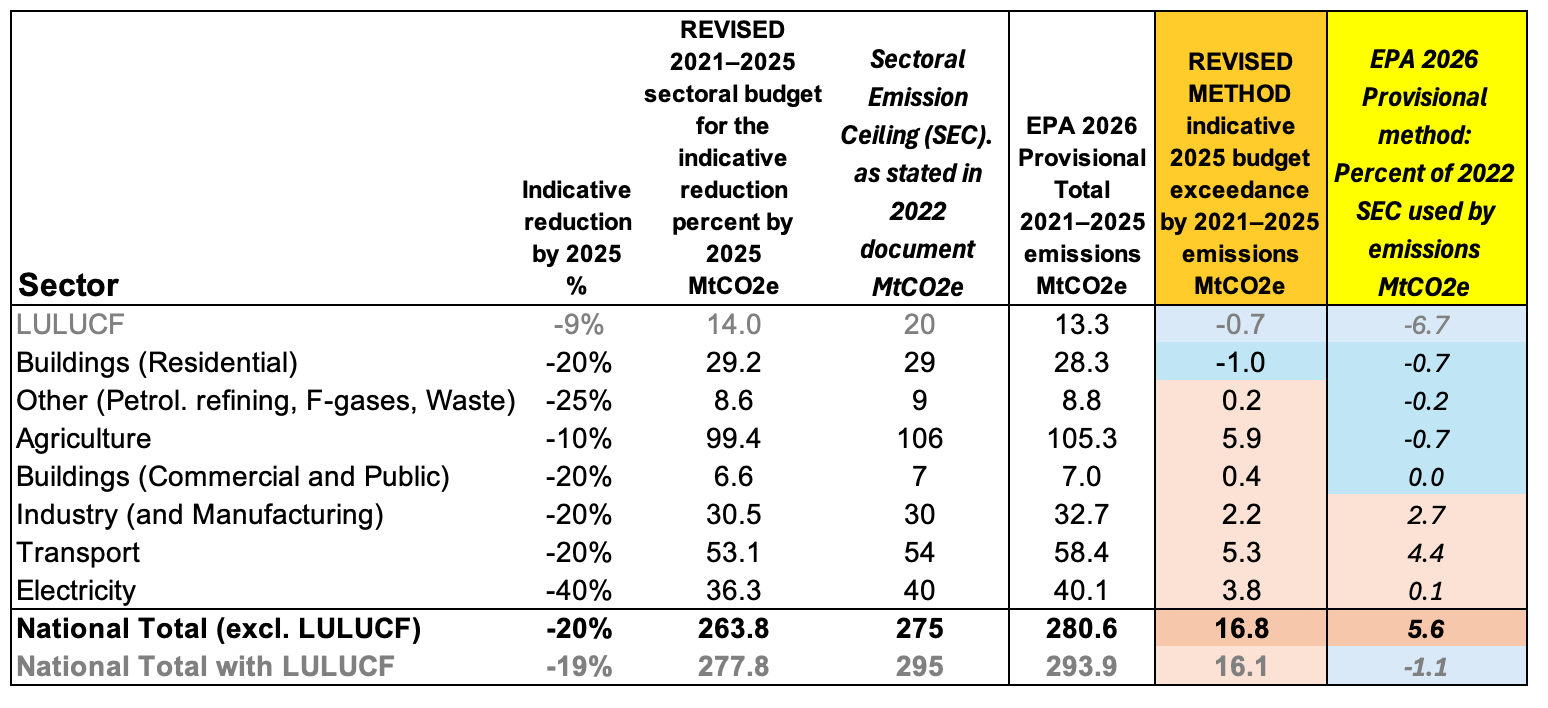
Note the national total with LULUCF of 277.8 MtCO2e for the sum of 2021–2025 indicative sectoral budgets, based on the approximate 2025 indicative percent reductions. This total is 17.2 MtCO2e less than the agreed CB1 of 295 MtCO2e. This provides another approximation estimate of the 'windfall' accounting bonus due to the scientific updates to the 2018 base year emissions. (As noted in my previous post, there is no one 'right way' to estimate this windfall but, at the very least, some quantification of it requires acknowledgment in any mitigation achievement assessment.
Comparing the provisional 2021–2025 emissions of 293.9 MtCO2e with the national total with LULUCF indicative budget of 277.8 MtCO2e, implies an adjusted-CB1 exceedance of 16.1 MtCO2e, an amount that would need to be subtracted from an adjusted-CB2 value if the percent reductions are a priority guideline – as the EPA carbon budget and sectoral achievements assessments suggest.)
Figure 3, below, graphically represents the Table 4 results, with orange bars for the Revised results and yellow bars for the EPA results.
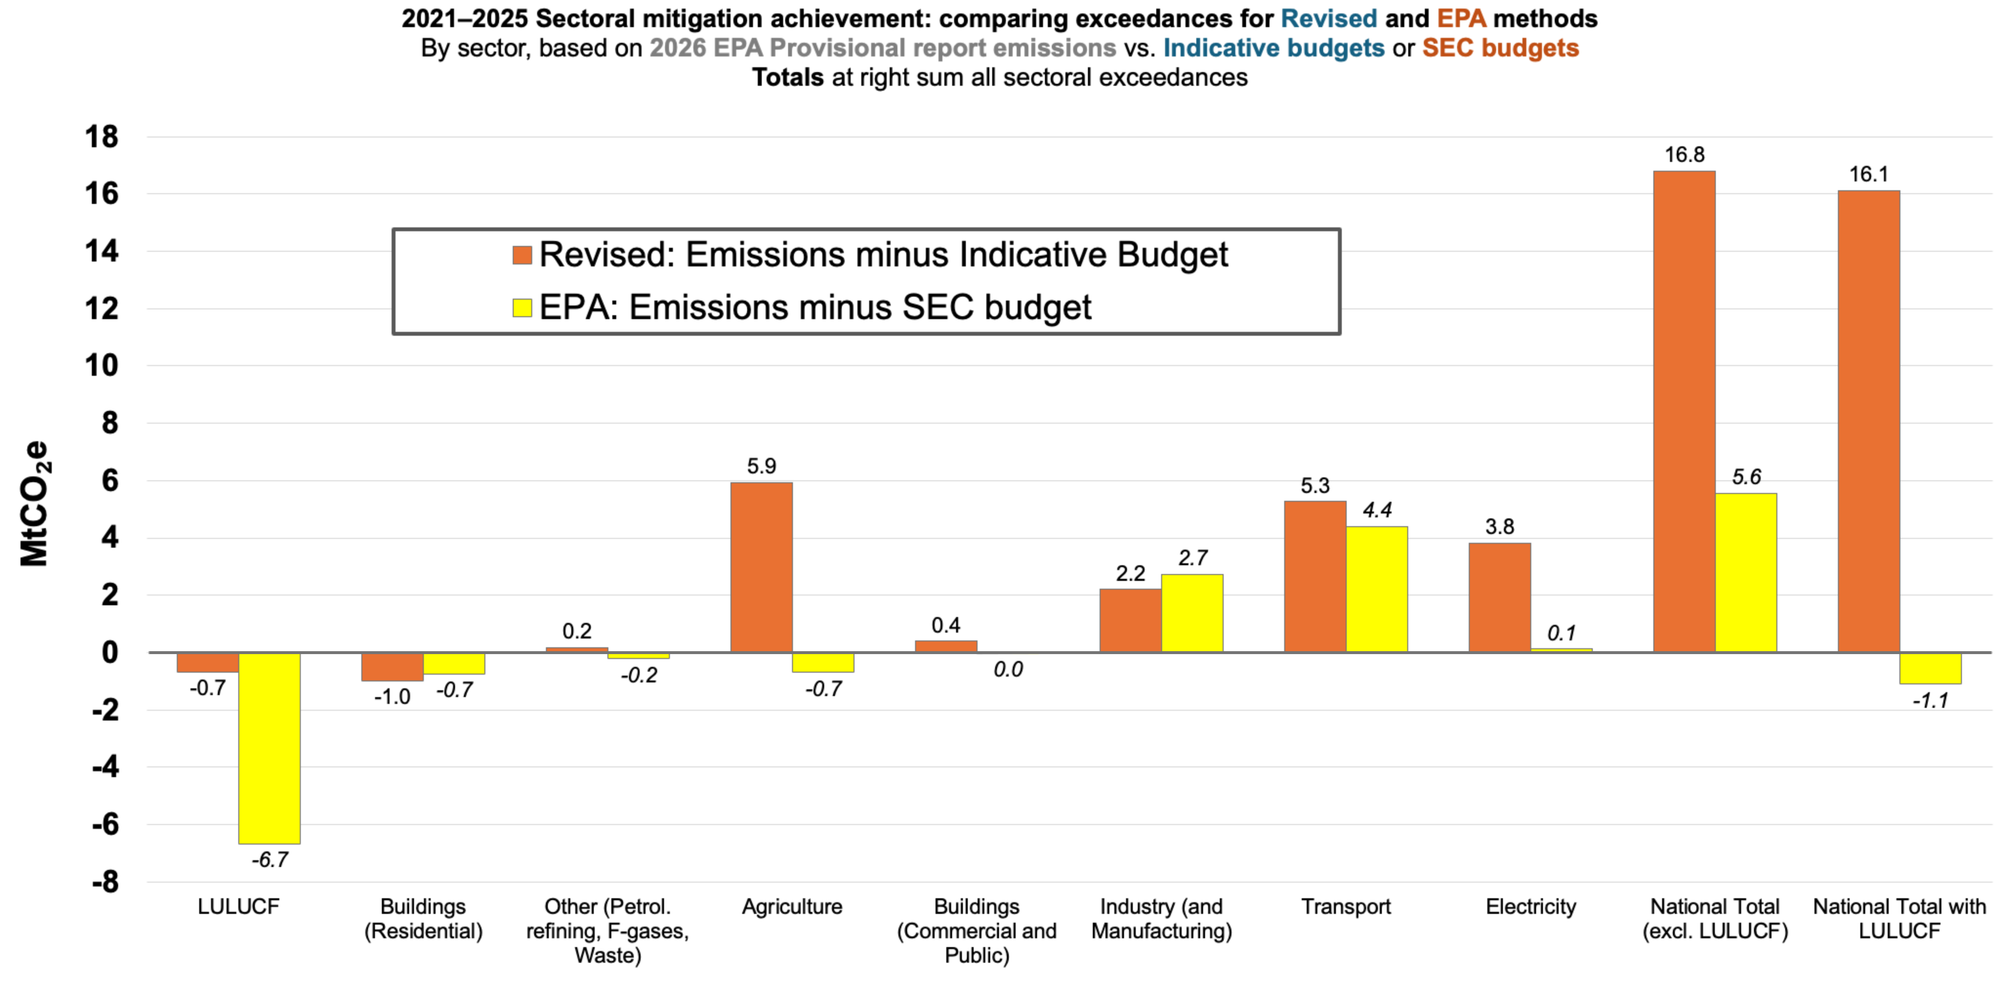
- Agriculture's Revised method 5.9 MtCO2e exceedance is the largest of any sector, with other substantial exceedances including Transport 5.3 MtCO2e, and Electricity 3.8 MtCO2e.
- Unlike these sectors, for Industry the EPA 2.7 MtCO2e exceedance is higher than the Revised method's 2.2 MtCO2e.
- The results for Other, and Buildings-Commercial|Public are similar (within o.4 MtCO2e) and close to zero exceedance from both methods.
- The results for Buildings (Residential) are also similar for both methods and both show this as the only named CAP sector that met its indicative sectoral budget or its SEC.
- Agriculture shows the largest tonnage contrast between methods: a difference of 6.6 MtCO2e between the Revised method exceedance of 5.9 MtCO2e and the EPA method which showed Agriculture staying within its 2022 SEC by -0.7 MtCO2e.
- The other named CAP sector with a large tonnage contrast between the two methods is Electricity with 3.7 MtCO2e between the Revised method exceedance of 3.8 MtCO2e and the EPA method's 0.1 MtCO2e exceedance.
LULUCF values are only implied from the other sectors' indicative percentages and SECs but they also show a marked difference of 6.0 MtCO2e between the Revised method's -0.7 MtCO2e and the EPA's -6.7 MtCO2e. In large part the LULUCF contrast is related to the large change in the updated 2018 base year value given in the 2026 Provisional report and used for to calculated the indicative budget.
These contrasts in tonnages between the two methods result in the very large differences between their results for the National Total with LULUCF. The EPA method finds that 2021–2025 emissions were 1.1 million tonnes less than CB1 of 295 MtCO2e (see caveats in previous post). By comparison, the Revised method shows that the same 2021–2025 provisional emissions were 16.1 MtCO2 in excess of a revised first carbon budget of 278 MtCO2e for more meaningful mitigation assessment, based on the indicative sectoral budgets.
A far more concerning picture of CB1 mitigation progress
As acknowledged by CCAC 2024 Cross-sectoral Review and the EPA 2026 Provisional report, the sectoral emission ceilings (SECs) are no longer meaningful for mitigation assessment due to scientific inventory updates to their 2018 basis and subsequent projected and inventory emissions. This makes the EPA report use of the outdated 2022 SECs as a basis for a sectoral summary statement highly questionable.
Therefore, this commentary details the results from a 'Revised method' based on the stated indicative reduction percentages by 2025 for each sector, as given in the key table in the Government's 2022 SEC document.
The EPA 2026 Provisional report's CAP Sectors data and summary statement provided a generally positive summary, finding that only Industry and Transport had substantially exceeded their SECs, and, overall, the legally binding CB1 of 295 MtCO2e was met with 1.1 MtCO2e to spare (although this provisional value does not include storm windfall losses that likely cause an exceedence of CB1).
In marked contrast, the results from a Revised method based on the sectoral indicative emission reduction percentage 2025 targets are starkly worse than the EPA reported assessment. Only one CAP Sector, Buildings-Residential, met its indicative target reduction. Six out of the seven named sectors failed to meet their indicative reduction budgets. Significant tonnage exceedances–primarily in Agriculture, Transport, Electricity and Industry—result in the more meaningful revised value of 278 MtCO2e for CB1 being exceeded by 16.1 MtCO2e.
The difference between these assessment methods is most stark for Agriculture. The EPA report states that the sector used 99.3% of its SEC, with a remaining budget surplus, after subtracting 2021–2025 emissions, of 0.7 MtCO2. These EPA 2026 Provisional report results for Agriculture were interpreted in a prominent Irish Times opinion piece as a "surprising success story".
To the contrary, the more valid Revised method detailed above—using an adjusted sectoral budget based on Agriculture's 10% target 2025 reduction—strongly counters any such interpretation. It finds a substantial mitigation failure by Agriculture, which used 106% of its indicative budget and thereby contributed a large emissions exceedance of 5.9 MtCO2 relative to its indicative 2021–2025 emissions budget. This is not a success story.
Conclusion: the revised assessment shows sectoral failures requiring urgent corrective policy action
Given the relative ease of achieving CB1, the revised results are especially concerning. They show a 16 MtCO2e exceedance of a meaningful first carbon budget and six out of seven sectors exceeding their 2021–2025 indicative target reduction budgets. The exceedance will increase further when the storm windthrow forest carbon losses are included next year in the final inventory report.
A similarly revised approach will be needed to revise the tonnages for CB2 and its SEC indicative budgets—including allocation among the sectors of the 26 MtCO2e in "unallocated savings"—to enable appropriate mitigation assessment for 2026–2030.
In response to these poor results for CB1 period sectoral mitigation, urgent commensurate corrective policy actions to accelerate mitigation achievement, most of all in Agriculture and Transport, needs to be instituted Government and for government departments to address the evidenced mitigation failure for 2021–2025. These corrective actions to correct for CB1 failure are needed in addition to the anticipated additional measures that are already required to address the fact that EPA Projections show planned actions to date are grossly insufficient to meet the much more difficult CB2 for 2026–2030.
The test of political intent to correct CB1 SEC mitigation failure to date as well as accelerate mitigation for CB2 will be revealed in the already long overdue Climate Action Plan, now due for publication in the last quarter of this year.
It is essential that advisory bodies including the CCAC and EPA provide the best possible mitigation assessment advice to avoid giving poor policy advice. This is particularly concerning when the advice given happens to be politically convenient in showing progress in a better light than is actually the case.
As this commentary shows, by failing to account for inventory updates, the EPA 2026 Provisional report's sectoral mitigation statement is misleadingly positive compared the poor sectoral results for 2021–2025 shown when the updates are accounted for.
Therefore, as a matter of urgency the CCAC and EPA need to provide a clear methodology to meet their own calls to proactively update assessment-relevant carbon budgets and sectoral emission ceilings to ensure that their reporting reflects actual progress towards decarbonisation of Ireland’s economy.
Note 1. Spreadsheet tables used to calculate implied LULUCF emissions and revised indicative sectoral budgets for 2021–2025
Grey: stated targets. Green = input data. Blue = key intermediate outputs. Purple = key table outputs. Italics = interpolated values.